Are you frustrated with not knowing whether or not your online marketing campaigns are affecting your business’s bottom line? Did you know that there is a way to track and measure this?
Google Analytics is tool you can use to track and measure whether or not your website and other digital marketing activities are fulfilling your business’s objectives and affecting your bottom line.
3 Steps to Setting Up Your Measurement Plan
Measuring your online marketing effectiveness and success starts with a solid measurement plan. Here are three steps to setting up your business objectives’ measurement plan using Google Analytics.
#1. Define Your Business Objectives
The first step in setting up a measurement plan is identifying and defining your business objectives. Business objectives are what you want your business to accomplish over a certain time frame (such as a month, a quarter, or a year). Many businesses who have an online presence often have business objectives such as:
- Increase lead capture by X% over the next month
- Increase online purchases or online sales by X% over the next quarter
#2. Determine Actions that You Need Your Online Users to Take that Will Lead to Accomplishing Your Business Objective(s)
The next step for an effective measurement plan is to determine what actions your online users need to take on your website that will result in the achievement of your objectives. These are often defined as short term goals.
- Example: To capture leads, you need your website visitors to either fill out a Request a Quote form or call you. In order to increase lead capture by X% over the next month, you need to gain at least X leads within the next month.
- Example: For online purchases, you need your online visitors to buy your product. In order to increase online purchases by X% over the quarter, you need to sell X products over the next quarter.
#3 Set Up Goal tracking in Google Analytics
There are different ways to track these user actions in Google Analytics. These user actions that we want to track are called “Goals” in Google Analytics.
Two useful Google Analytics goals for tracking bottom line objectives are destination goals and ecommerce goals.
Using Destination Goals for Measuring Lead Capture Efforts
Think about how an online “Contact Us” form works or a “Request a Quote.”
After filling out a form and hitting submit, a form will typically do one of two things: display a message saying “Thank you, we will get back to you shortly” or it will redirect to a different page on your website (usually a Thank You page). The easiest way to track these form submissions is if they redirect to a new URL (a Thank You page). Your web developer can easily make your forms do this.
Once your form redirects to a Thank You page after it is filled out and submitted, take the URL of that Thank You page and go to Google Analytics.
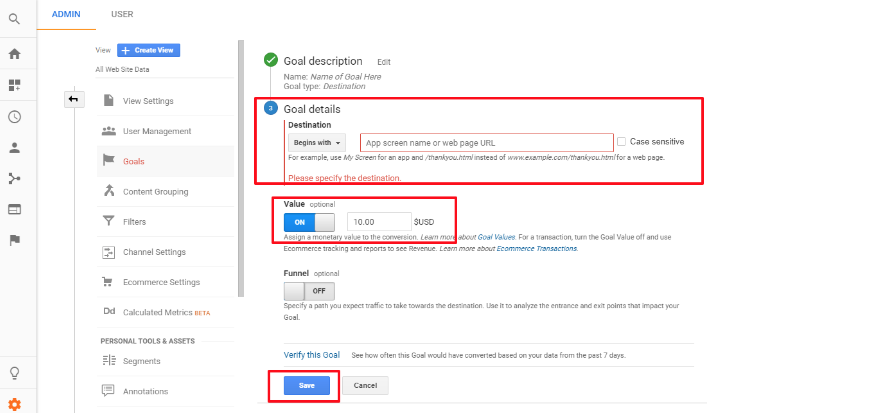
- Go to "Admin > View > Goals." Click “New Goal.”
- Under "Goal Set Up," select “Custom”
- Under "Goal Description > Name," give your goal a descriptive name (ex: “Contact Us Form Submissions”)
- Under "Goal Description > Type," select “Destination”
- Under "Goal Details," add the URL of your Thank You Page.
- Assign your goal a value (example: if it generally takes you 10 leads before closing 1 sale and 1 sale is on average $100, then value each lead at $10)
- Click save.

Once this is done, Google Analytics will keep a running tally every time a person gets to that Thank You page.
Using Ecommerce Goals
If you run an ecommerce business, you can use ecommerce goals “to track transactions and analyze purchase activity on your site or app. You can see product and transaction information, average order value, ecommerce conversion rate, time to purchase, and other data.” This is a little more complicated to set up and usually requires a web developer.
How to Use the Goal Data
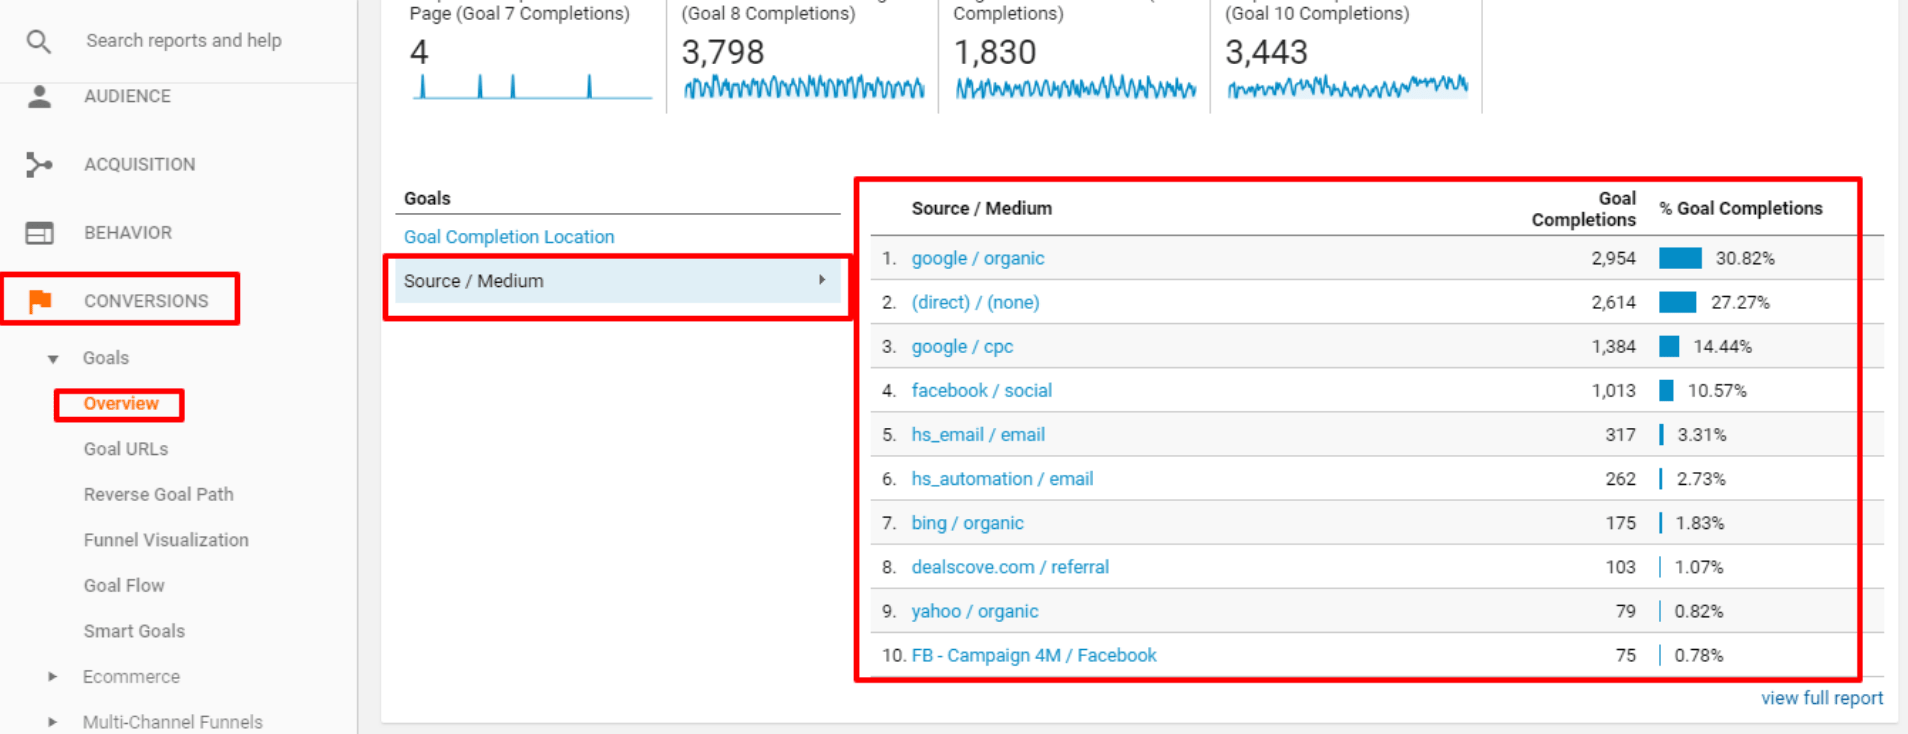
After you set up your goals, Google Analytics will begin keeping a running tally every time one is completed. You can have up to 20 active goals at one time. To view goal data, go to the “Conversions” reports in Google Analytics.
![]()
Once in the Conversions report, pick a specific date range to review (i.e. a month, a week, 3 months, a year, or any custom time period). You will find conversion rate data and the total number of goals completed for that time period.
You can even do a date comparison - such as July vs. June or this year vs. last year. This will help you determine if your digital marketing efforts are working and if you are on the right path to achieving your business objectives.
The Conversions report provides a range of useful marketing metrics. For example, it will show you what online traffic sources are contributing to those goal completions (i.e. traffic from Google, social media, email marketing, etc). This will give you an idea of how well each digital marketing channel is performing and if you need to make any changes to improve in those areas.

Questions to Ask When Reviewing the Goal and Conversion Data
Once you start making changes to your website or run a specific online advertising campaign, check the data in the Conversions report and ask yourself:
After implementing changes, do you see improvements?
If you don’t see an improvement or if you see a drop in goal completions, this may be indicating that your current efforts are not working. You may need to go back to the drawing board and try something new.
Perhaps your landing page isn't user friendly or the content is not clear. Or perhaps your messaging does not resonate with your potential customers. Consider making these small changes and then keep an eye on Google Analytics reports to determine if there is any improvements.
Does this data make sense?
However, seeing a drop in conversions may not be a sign of a problem. Don’t forget to take into context factors such as seasonality (ex: some businesses see more sales or leads during the summer vs winter) or any marketing efforts you are conducting that could influence your data (ex: running or stopping a PPC advertising campaign).
It is important to follow up and review your data on a consistent basis. You won’t be able to catch problems early if you don’t consistently analyze your data. It’s easy and less costly to fix a problem sooner rather than later.
Finally, some parting Google Analytics wisdom: Always ask yourself questions when looking at data. Does this data make sense? If no, why not? Am I seeing improvements? If no, why not? Without such questions, you won’t be able to fix problems or optimize for profitable opportunities.


