Google Analytics can be daunting for beginners. When you log into your account, the amount of information Google provides can be overwhelming. Where do you even start? What data is most important to look at? How do apply this information to your business? Also, you may see a lot of metrics and terminology that may not be familiar to you.

If you don’t know where to start and what data is useful, it’s really hard to act on that data. And you can make bad decisions. So how do we avoid making bad decisions with data? And how do we use it to make profitable decisions?
It all starts with reading Google Analytics reports the RIGHT way.
3 Steps to Analyzing Your Google Analytics Data
Before you even look at your data, you need some context and reference points to frame your data. If you don’t frame your data, you won’t be able to properly analyze it.
#1 Understand the Context of Your Data
Before digging in, you need to collect information on what could be affecting your data. Understanding the context of your data means knowing your industry/marketplace, your marketing efforts, and any seasonal or external influences that can affect your data. Use this context when you look at your data and ask yourself: “Does this make sense based on the context?” For example, it would make sense for a seasonal business who normally gets less business in the winter to see a drop in website traffic during those months
#2 Set Up Goals to be Used as Reference Points
To explain what a reference point is I’ll start with an example. Let’s say you had 1000 visitors come to your website in July, and then in August, 2000 visitors came to your site.
Is this increase a good or bad thing?
Well, there isn’t enough information to make this determination. It would be bad if you spent money on Google Ads to increase traffic, but none of them converted into customers. So, in order to make that determination of whether or not the traffic spike was a good thing, you need a reference point to compare that visitor traffic data against.
The reference point in this example would be number of customers. Now Google doesn’t count customers exactly, but it can track certain valuable actions people take on your site - such as purchases or form submissions - and Google Analytics calls these actions “goals.” Therefore, if you don’t have goals set up, set them up now (located in the Admin section). You can even tie these goals to a dollar value to help determine ROI!
Once you have goals set up, you’ll have good reference points to compare your other data against. And, you’ll be fully ready to dig into your data and gain actionable insights.
#3 Understand How to Use the 4 Main Reporting Sections in Google Analytics
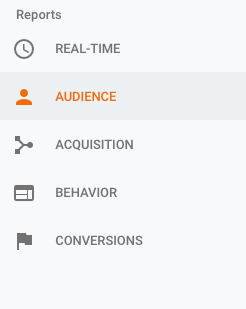
There are 4 main reporting areas that we’ll cover. When you are in the dashboard, you will notice on the left hand side the main reporting sections: Audience, Acquisition, Behavior, and Conversions. Let’s take a look at understanding each of these sections.
Audience Reports: Who Came to Your Website?
The Audience report shows data about who came to your website. The Audience overview section will give you information such as the number of total web visitors (new and returning), locations of visitors, language of visitors, and the type of device and browsers those visitors used.
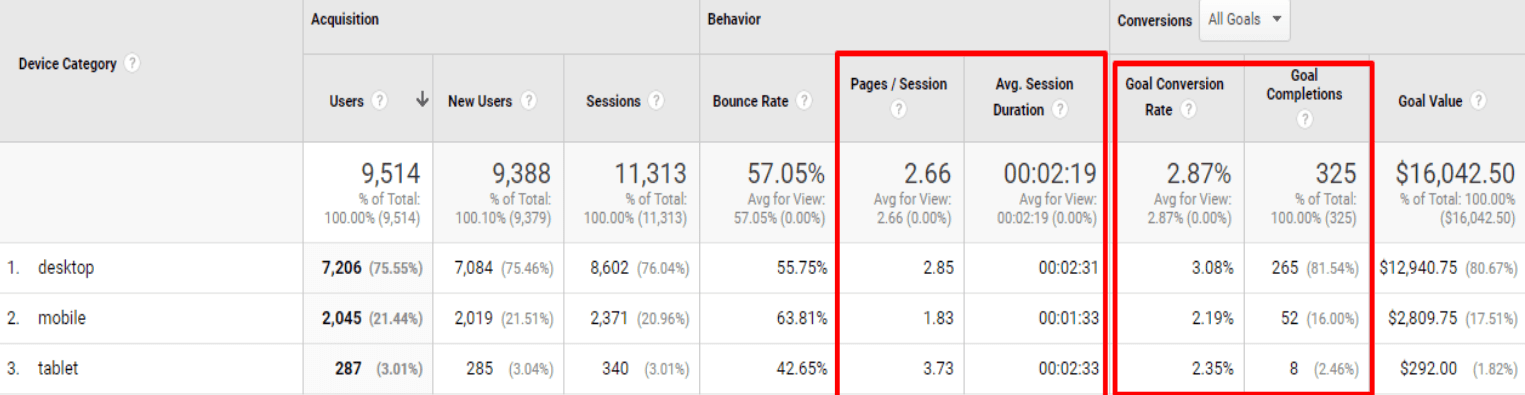
Additionally, in the Audience Report, you can find sub-sections that dive more into the weeds. In the Mobile Overview reports section under Audience, you’ll find data about the type of devices people are using to visit your website: desktop, mobile, and tablet. If you have goals set up, you will be able to see how many goals were completed on each device and the conversion rate. If, for example, you notice that the mobile conversion rate and goals are really low compared to desktop, you may have a user experience issue with the mobile version of the site. (Many businesses have a great looking website on desktop, but it isn’t user friendly on mobile devices.)
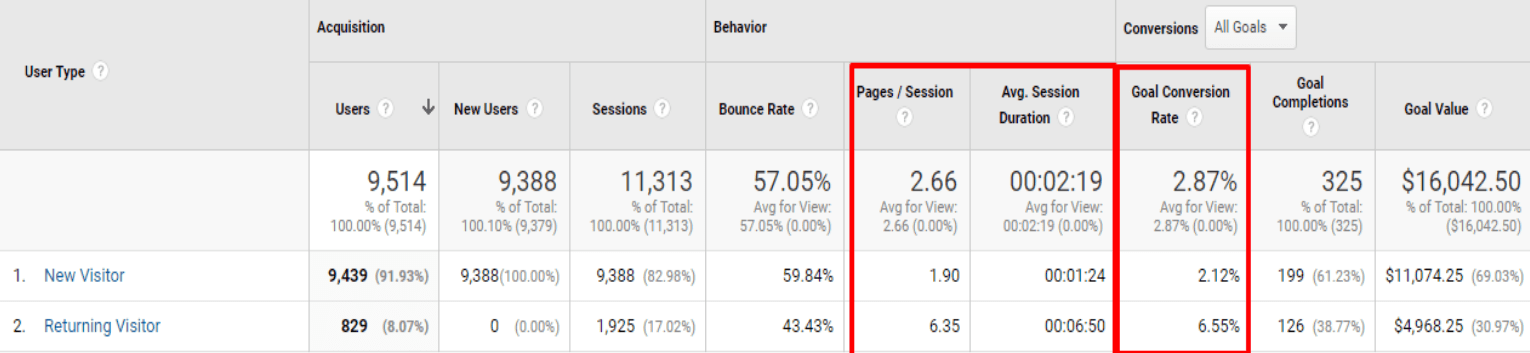
Another great report to look at is the New vs. Returning Users report under Audience. Again, if you have goals set up, you will be able to see the conversion rate and number of goals completed for new users versus returning users. If you are running a customer delight initiative to get current customers to purchase from you again, this is a great area to determine if your efforts are working.
Acquisition Reports: How Did They Get To Your Website?
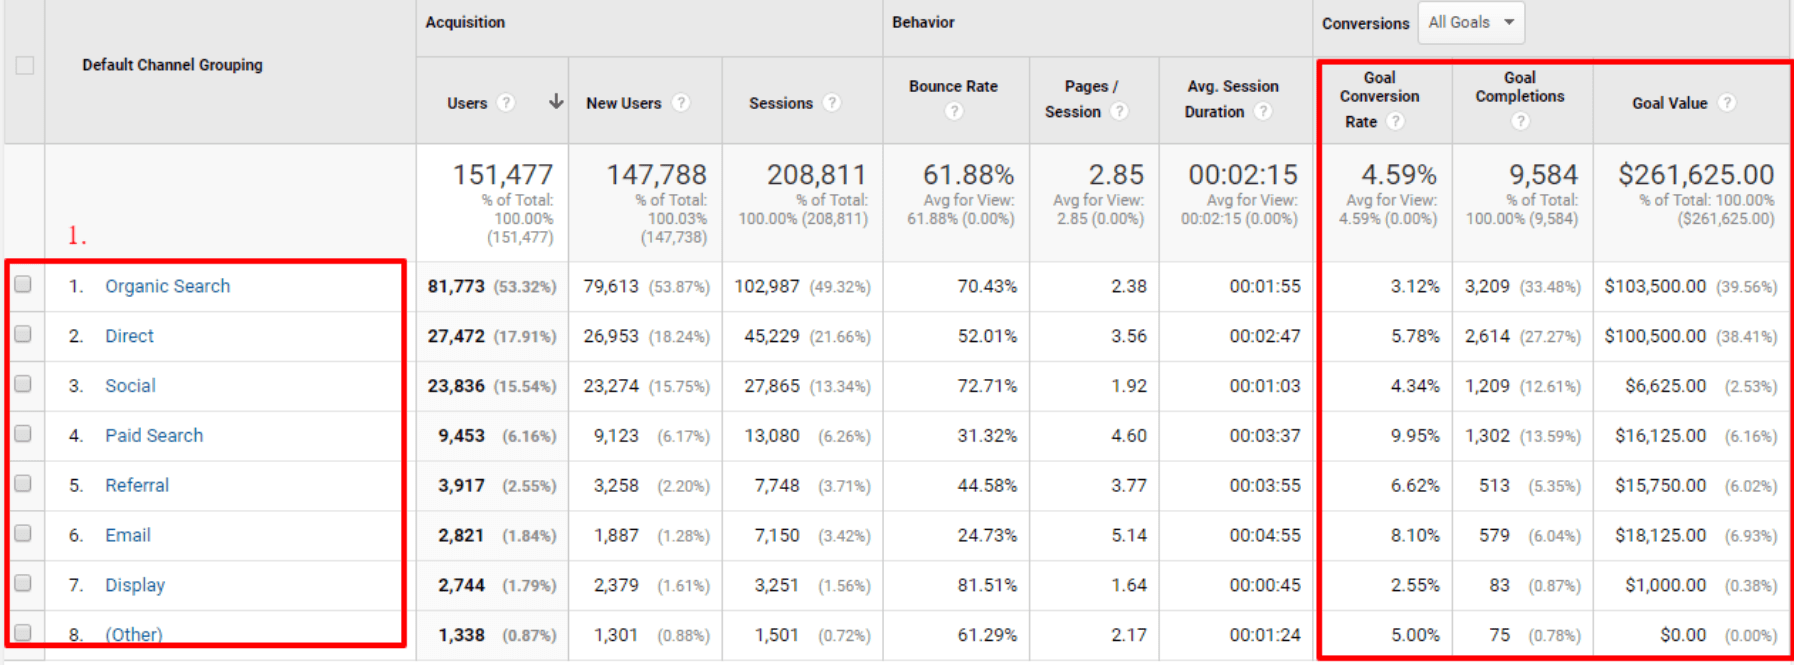
Do you know what channels people are coming to your website from? The Acquisition Report shows how people are getting to your website - whether that is from Google organic search, social media, email, other search engines, etc. The All Traffic report under Acquisition gives a great breakdown of the ways people came to your site. If you have goals set up, you will be able to see how well each channel is performing during a specific date range. You can even compare a specific time period against another time period (such as July vs June) to see if you are improving in a specific channel.
Behavior Reports: What Did They Do On Your Website?
The behavior reports tell us two important things: what page did visitors enter your website on and what did they do once they got to your website. Not every visitor enters your website via the homepage (although most may). Also, the page they entered your website on may give you a clue as to what they wanted when they arrived on your website.
In the Landing Pages report under Behavior, you will find a break down of the popular pages that people enter your website on. If you have goals set up, you will be able to determine how that page is performing based on the conversion rate and goals completed. If, for example, people who enter in on a specific service page have a conversion rate of 0%, there is an issue with that page. The site content or messaging may be wrong or it may be difficult for them to convert (i.e. make a purchase, fill out a form, or call).
Also in the Behavior reports section is the Behavior Flow report. This is a visual representation of how people navigate your website. It shows what pages people enter your site on and then what pages they go to next or if they leave the website. If you notice a large amount of people are leaving your website on a certain page and they should not be, then you may have to change the content or user experience on that page.
Conversions Reports: Did They Do What You Wanted Them To Do?
All this data is great, but what it comes down to is: are you winning or losing at your online marketing? In other words, are you bringing in more leads or getting people to purchase your products? Are visitors doing what you want them to on your website?
Google Analytics goals can help answer this. If you set up your goals, the Conversions reports provides information on your goal conversions. It keeps a running tally on how many goals were completed. It also shows you what pages and acquisition sources are performing the best and converting people.